
The Tyne catchment is huge, covering an area of 2,900km2, with 4,399km (2,733 miles) of rivers discharging 1.41 trillion litres of water into the sea per year [1] [2] . It is a complex ecosystem facing multiple complex threats. The river and the ecosystems it supports are subject to massive inputs of pollutants including raw sewage, urban and agricultural runoff, to extraction of water for human use, to barriers and blockages and the ravages of climate change.
Flood and drought
The Tyne catchment suffers from extremes of weather, with significant swings in rainfall as a result of climate change. March 2025 was the driest in England since 1961, with only 25% rainfall compared to the average leading to the South Tyne recording its lowest March flows on record [3] . Excessive dry weather makes the ground impermeable and heightens the risk of flooding, with a trend towards more extreme flood events in recent decades, such as Storm Desmond in 2015 [4].
Sewage
Combined Sewer Overflows
The Tyne Catchment has 463 storm overflows allowed to release sewage into the rivers. Despite a drop of around 50% compared to 2024, over 31,000 cumulative hours of water mixed with sewage were released into our rivers in 2025 [5].
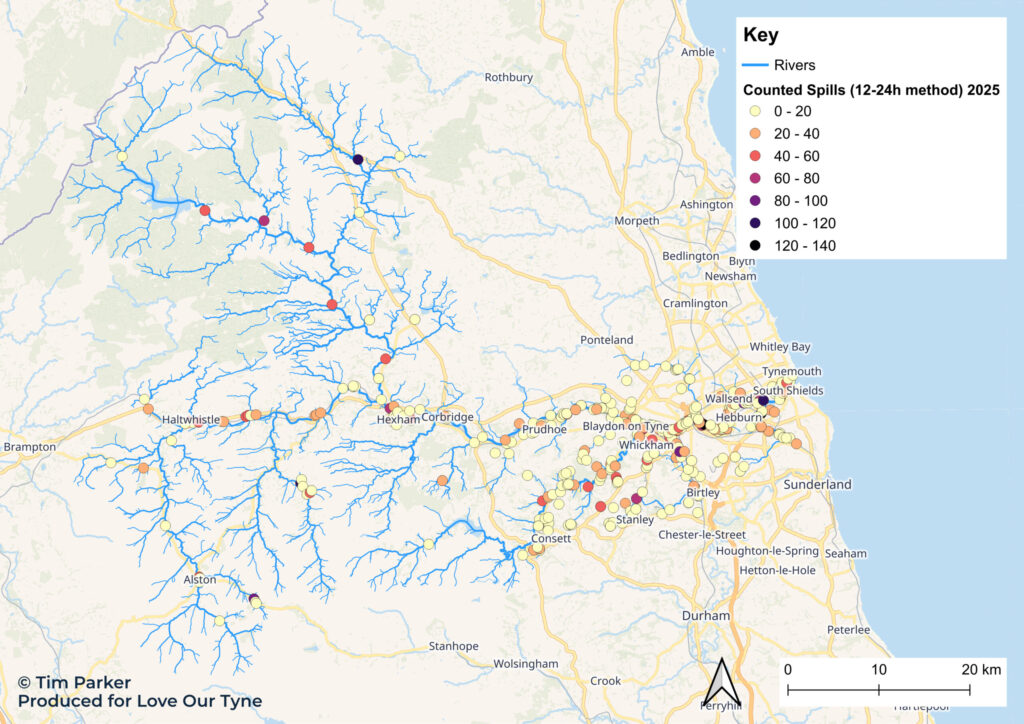
Combined Sewer Overflows in the Tyne Catchment [5] [6] [7]. Background map © OpenStreetMap
Septic tanks
The rural Tyne Catchment means areas like the North Tyne have high numbers of septic tanks many of which may be unrecorded, and of which up to 80% may be leaking, adding nutrients into rural streams [8] [9] [10].
Invasive non-native species
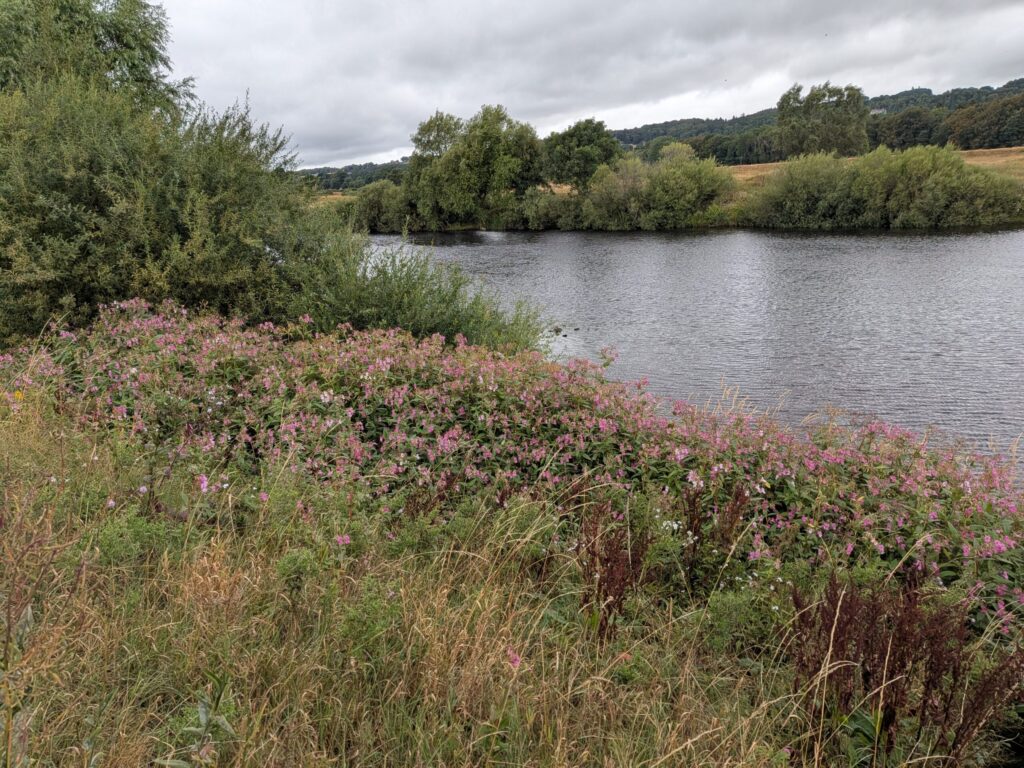
Rivers and their ecosystems across the Tyne catchment are under pressure from rapidly spreading invasive non-native species, including American Signal Crayfish which outcompete and spread disease to native, white-clawed crayfish, a species which finds refuge in smaller streams in the region. Japanese Knotweed, Himalayan Balsam and dangerous Giant Hogweed are a growing pressure along riverbanks, and while aquatic species like Floating Pennywort and Water Fern are rare in the Tyne Catchment, a warming climate and their ability to reproduce rapidly mean they are a threat for the future [11].
Land use pressures
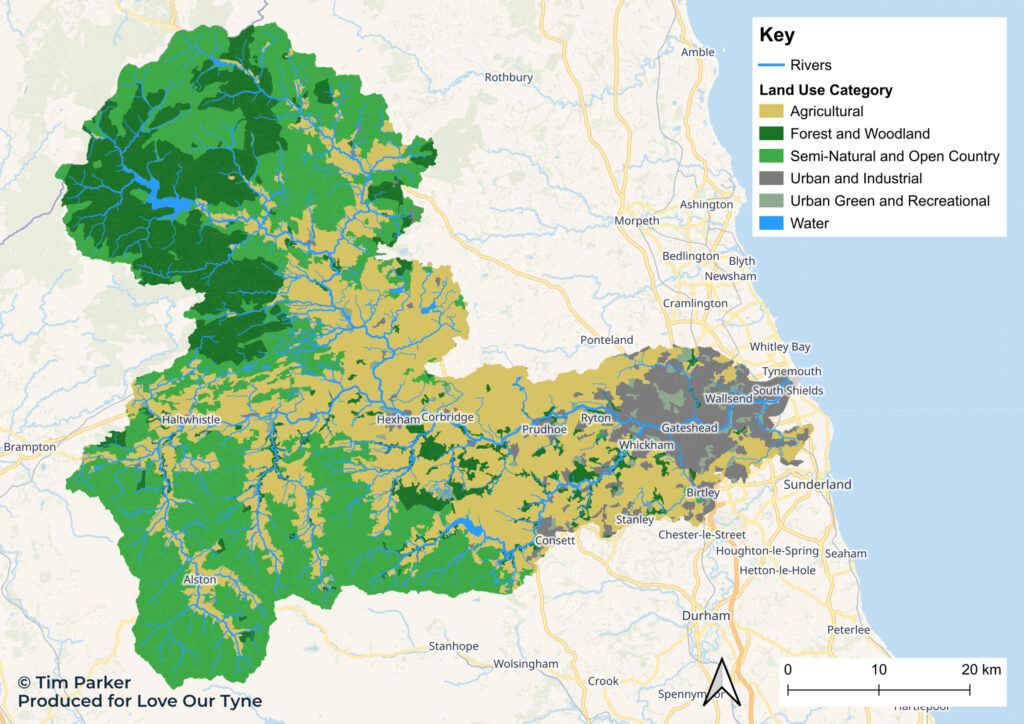
Tyne catchment land use proximity to rivers. Categories aggregated from CORINE [12]. Background map © OpenStreetMap.
Agricultural runoff
Over 35% of the total catchment is used for farming across 1,800 holdings [14] [12] [13], much of it pasture used for grazing sheep or cattle creating a high risk of nutrient-rich animal waste entering watercourses or overly enriching soils. Across the UK, 40% of water bodies are negatively affected by diffuse agricultural runoff, and in many regions it is a larger threat to rivers than sewage [15].
Urban and industrial pollution
The catchment has a long history of mining and industrial use, most of which ended by the mid-20th Century. Despite this, 150km of Tyne Catchment waterways are still directly polluted by zinc, cadmium and lead which are toxic to aquatic life and can have impacts for hundreds of years [16].
Nationwide, 18% of waterbody failures are attributed to diffuse urban pollution – widespread runoff from surfaces like tarmac, from homes and businesses [17] .
Road runoff
There are over 7,200km of roads in the Tyne catchment, producing estimated runoff of between 18.9 billion and 50.2 billion litres per year – that’s 7,500 to 20,000 Olympic sized swimming pools [18] [19] . Road runoff contains heavy metals, endocrine disruptors, microplastics and petrochemicals. When this toxic mix enters fresh water, it can interrupt breeding cycles of the animals and plants that live there.
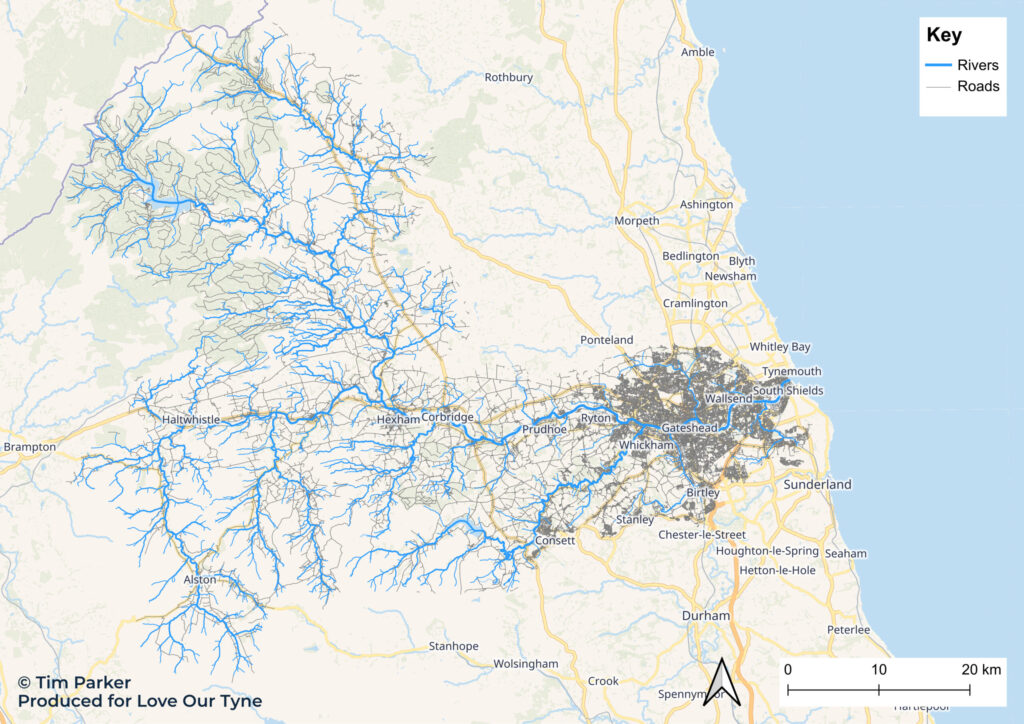
Tyne catchment road proximity to rivers [19]. Background map © OpenStreetMap.
Dams and artificial channels
An unknown number of artificial dams, channels and culverts alter the flow of rivers in the Tyne catchment. National estimates suggest up to 1 per km, meaning our catchment could have more than 4,000 impediments to natural flow [20].
References
[1] Tyne Rivers Trust, ‘The River Tyne – History, Origins & Future’. Accessed: Oct. 19, 2026. [Online]. Available: https://www.tyneriverstrust.org/the-river-tyne/
[2] Dr. N. Milner, N. O’Keeffe, R. Waterfall, M. Hubble, and H. Webb, ‘River Tyne Salmon Action Plan Review’, 2008.
[3] M. Kendon et al., ‘State of the UK Climate in 2025’, International Journal of Climatology, vol. 46, no. S1, Jul. 2026, doi: 10.1002/joc.70470.
[4] UKCEH, ‘NRFA station data for 23001 – Tyne at Bywell’. Accessed: Oct. 28, 2026. [Online]. Available: https://nrfa.ceh.ac.uk/data/station/info/23001
[5] Environment Agency, ‘Event Duration Monitoring – Combined Sewer Overflows’. Accessed: Oct. 02, 2026. [Online]. Available: https://environment.data.gov.uk/dataset/21e15f12-0df8-4bfc-b763-45226c16a8ac
[6] Stream, ‘Northumbrian Water Storm Overflow Activity | Stream – Portal’. Accessed: Oct. 10, 2026. [Online]. Available: https://www.streamwaterdata.co.uk/datasets/2d91e4a41b884c9a9dd58dec4ee49b75_0/explore?location=55.102245%2C-1.742755%2C8
[7] Geodata and River Restoration Centre, ‘OPENRIVERS – Download’. Accessed: Sep. 29, 2025. [Online]. Available: https://openrivers.net/download/
[8] H. P. Jarvie, C. Neal, and P. J. A. Withers, ‘Sewage-effluent phosphorus: A greater risk to river eutrophication than agricultural phosphorus?’, Science of the Total Environment, vol. 360, no. 1–3, pp. 246–253, May 2006, doi: 10.1016/j.scitotenv.2005.08.038.
[9] L. May, C. Place, M. O’Malley, and B. Spears, The impact of phosphorus inputs from small discharges on designated freshwater sites. Natural England Commissioned Reports (170), 2015. [Online]. Available: www.naturalengland.org.uk/copyright.
[10] M.-P. Gosselin, ‘North Tyne Catchment desk study – Identification of historical factors responsible for the decline of freshwater pearl mussel (Margaritifera margaritifera).’, Sep. 01, 2011
[11] A. Aileen and P. N. Stevens ERIC Emily, ‘Non-Native Species Strategy & Action Plan NORTH EAST’.
[12] B. Cole et al., ‘Corine land cover 2018 for the UK, Isle of Man, Jersey and Guernsey’, 2021, NERC EDS Environmental Information Data Centre.
[13] DEFRA, ‘Water Framework Directive (WFD) River Water Body Catchments Cycle 3 Classification 2019 (Full Resolution)’. Accessed: Oct. 02, 2025. [Online]. Available: https://environment.data.gov.uk/dataset/2803f216-f579-4f05-be16-ee11af4c1320
[14] Tyne Rivers Trust, ‘Land Management and Farming’. Accessed: Oct. 02, 2026. [Online]. Available: https://www.tyneriverstrust.org/our-work/land-management-and-farming/
[15] Environment Agency, ‘World Rivers Day: What are the biggest causes of river pollution and what’s being done about them?’ Accessed: Nov. 04, 2026. [Online]. Available: https://environmentagency.blog.gov.uk/2024/09/22/world-rivers-day-what-are-the-biggest-causes-of-river-pollution-and-whats-being-done-about-them/
[16] Mining Remediation Authority and Environment Agency, ‘Metal pollution in the Tyne Catchment | Water And Abandoned Metal Mines Programme’. Accessed: Oct. 19, 2026. [Online]. Available: https://www.miningremediation.co.uk/project-spaces/nenthead/metal-pollution-in-the-tyne-catchment/
[17] Environment Agency, ‘Written evidence submitted by the Environment Agency (WQR0029)’, 2020. Accessed: Oct. 02, 2026. [Online]. Available: https://committees.parliament.uk/writtenevidence/22353/pdf/
[18] R. A. Sanderson et al., ‘Spatio-temporal models to determine association between Campylobacter cases and environment’, Int. J. Epidemiol., vol. 47, no. 1, pp. 202–216, Feb. 2018, doi: 10.1093/ije/dyx217.
[19] Ordnance Survey, ‘OS Open Roads’, 2026. Accessed: Oct. 09, 2026. [Online]. Available: www.ordnancesurvey.co.uk/products/os-open-roads [20] The Rivers Trust, ‘[The Source Code] Mapping barriers in our rivers | The Rivers Trust’. Accessed: Oct. 02, 2026. [Online]. Available: https://theriverstrust.org/about-us/news/source-code-mapping-barriers-in-rivers
[20] The Rivers Trust, ‘[The Source Code] Mapping barriers in our rivers | The Rivers Trust’. Accessed: Oct. 02, 2026. [Online]. Available: https://theriverstrust.org/about-us/news/source-code-mapping-barriers-in-rivers